| Listing 1 - 10 of 10 |
Sort by
|
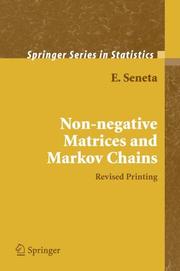
ISBN: 0387297650 9780387297651 0387905987 3540905987 9786610619009 1280619007 0387327924 9780387905983 Year: 2006 Publisher: New York : Springer,
Abstract | Keywords | Export | Availability | Bookmark
 Loading...
Choose an application
- Reference Manager
- EndNote
- RefWorks (Direct export to RefWorks)
“This book is a photographic reproduction of the book of the same title published in 1981, for which there has been continuing demand on account of its accessible technical level. Its appearance also helped generate considerable subsequent work on inhomogeneous products of matrices. This printing adds an additional bibliography on coefficients of ergodicity and a list of corrigenda. Eugene Seneta received his Ph.D. in 1968 from the Australian National University. He left Canberra in 1979 to become Professor and Head of the Department of Mathematical Statistics at the University of Sydney. He has been a regular visitor to the United States, most frequently to the University of Virginia. Now Emeritus Professor at the University of Sydney, he has recently developed a renewed interest in financial mathematics. He was elected Fellow of the Australian Academy of Science in 1985 and awarded the Pitman Medal of the Statistical Society of Australia for his distinguished research contributions. The first edition of this book, entitled Non-Negative Matrices, appeared in 1973, and was followed in 1976 by his Regularly Varying Functions in the Springer Lecture Notes in Mathematics, later translated into Russian. Both books were pioneering in their fields. In 1977, Eugene Seneta coauthored (with C. C. Heyde ) I.J. Bienaymé : Statistical Theory Anticipated, which is effectively a history of probability and statistics in the 19th century, and in 2001 co-edited with the same colleague Statisticians of the Centuries, both published by Springer. Having served on the editorial board of the Encyclopedia of Statistical Science, he is currently Joint Editor of the International Statistical Review.” [Publisher]
Stochastic processes --- Non-negative matrices --- Markov processes --- Matrices non négatives --- Markov, Processus de --- Matrices non négatives --- EPUB-LIV-FT LIVSTATI SPRINGER-B --- Matrices --- Probabilités. --- Probabilities --- Probabilités
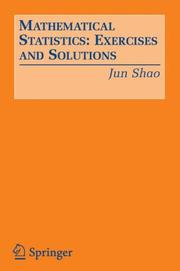
ISBN: 0387249702 9780387249704 9786610612079 128061207X 0387282769 Year: 2005 Publisher: New York, NY : Springer New York : Imprint: Springer,
Abstract | Keywords | Export | Availability | Bookmark
 Loading...
Choose an application
- Reference Manager
- EndNote
- RefWorks (Direct export to RefWorks)
This book consists of four hundred exercises in mathematical statistics and their solutions, over 95% of which are in the author's Mathematical Statistics, Second Edition (Springer, 2003). For students preparing for work on a Ph.D. degree in statistics and instructors of mathematical statistics courses, this useful book provides solutions to train students for their research ability in mathematical statistics and presents many additional results and examples that complement any text in mathematical statistics. To develop problem-solving skills, two solutions and/or notes of brief discussions accompany a few exercises. The exercises are grouped into seven chapters with titles matching those in the author's Mathematical Statistics. On the other hand, the book is stand-alone because exercises and solutions are comprehensible independently of their source, and notation and terminology are explained in the front of the book. Readers are assumed to have a good knowledge in advanced calculus. A course in real analysis or measure theory is highly recommended. If this book is used with a statistics textbook that does not include probability theory, then knowledge in measure-theoretic probability theory is required. Jun Shao is Professor of Statistics at the University of Wisconsin, Madison.
Mathematical statistics --- Statistique mathématique --- Problems, exercises, etc. --- Problèmes et exercices --- Mathematical statistics. --- Mathematical statistics - Problems, exercises, etc. --- Mathematics --- Physical Sciences & Mathematics --- Mathematical Statistics --- Statistics --- Statistique mathématique --- Problèmes et exercices --- EPUB-LIV-FT LIVSTATI SPRINGER-B --- Statistics. --- Statistical Theory and Methods. --- Statistical inference --- Statistics, Mathematical --- Probabilities --- Sampling (Statistics) --- Statistical methods --- Statistics . --- Statistical analysis --- Statistical data --- Statistical science --- Econometrics
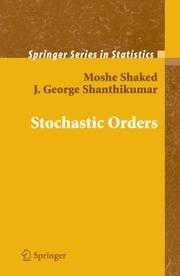
ISBN: 0387329153 9780387329154 1441921958 9786610816279 1280816279 0387346759 Year: 2007 Publisher: New York, NY : Springer New York : Imprint: Springer,
Abstract | Keywords | Export | Availability | Bookmark
 Loading...
Choose an application
- Reference Manager
- EndNote
- RefWorks (Direct export to RefWorks)
Stochastic ordering is a fundamental guide for decision making under uncertainty. It is also an essential tool in the study of structural properties of complex stochastic systems. This reference text presents a comprehensive coverage of the various notions of stochastic orderings, their closure properties, and their applications. Some of these orderings are routinely used in many applications in economics, finance, insurance, management science, operations research, statistics, and various other fields of study. And the value of the other notions of stochastic orderings still needs to be explored further. This book is an ideal reference for anyone interested in decision making under uncertainty and interested in the analysis of complex stochastic systems. It is suitable as a text for advanced graduate course on stochastic ordering and applications. Moshe Shaked is Professor of Mathematics at the University of Arizona, Tucson, AZ. He has made several fundamental contributions to the development of stochastic ordering and stochastic convexity, with applications in reliability theory and economics. He has published over 150 papers in this and related areas. J. George Shanthikumar is Professor of Industrial Engineering and Operations Research at the University of California, Berkeley, CA. He has made fundamental contributions to the application of stochastic ordering and stochastic convexity to queueing and related problems that arise in operations research and management science. He has published over 250 papers in this and related fields.
Stochastic processes --- Stochastic orders --- Ordres stochastiques --- Stochastic orders. --- Mathematics --- Physical Sciences & Mathematics --- Mathematical Statistics --- 519.2 --- Orderings, Stochastic --- Orders, Stochastic --- Stochastic orderings --- Distribution (Probability theory) --- EPUB-LIV-FT LIVSTATI SPRINGER-B --- Statistics. --- Statistical Theory and Methods. --- Mathematical statistics. --- Statistical inference --- Statistics, Mathematical --- Statistics --- Probabilities --- Sampling (Statistics) --- Statistical methods --- Statistics . --- Statistical analysis --- Statistical data --- Statistical science --- Econometrics
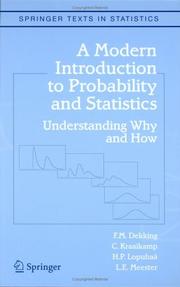
ISBN: 1852338962 9781852338961 1849969523 1846281687 Year: 2005 Publisher: London : Springer London : Imprint: Springer,
Abstract | Keywords | Export | Availability | Bookmark
 Loading...
Choose an application
- Reference Manager
- EndNote
- RefWorks (Direct export to RefWorks)
Probability and Statistics are studied by most science students, usually as a second- or third-year course. Many current texts in the area are just cookbooks and, as a result, students do not know why they perform the methods they are taught, or why the methods work. The strength of this book is that it readdresses these shortcomings; by using examples, often from real-life and using real data, the authors can show how the fundamentals of probabilistic and statistical theories arise intuitively. It provides a tried and tested, self-contained course, that can also be used for self-study. A Modern Introduction to Probability and Statistics has numerous quick exercises to give direct feedback to the students. In addition the book contains over 350 exercises, half of which have answers, of which half have full solutions. A website at www.springeronline.com/1-85233-896-2 gives access to the data files used in the text, and, for instructors, the remaining solutions. The only pre-requisite for the book is a first course in calculus; the text covers standard statistics and probability material, and develops beyond traditional parametric models to the Poisson process, and on to useful modern methods such as the bootstrap. This will be a key text for undergraduates in Computer Science, Physics, Mathematics, Chemistry, Biology and Business Studies who are studying a mathematical statistics course, and also for more intensive engineering statistics courses for undergraduates in all engineering subjects.
Mathematical statistics --- Probability theory --- Probabilities --- Probabilités --- Statistique mathématique --- Handbooks, manuals, etc. --- Guides, manuels, etc --- Harmonic analysis. --- Mathematical statistics -- Textbooks. --- Probabilities -- Textbooks. --- Probabilities. --- Stochastic analysis. --- Mathematical Statistics --- Mathematics --- Physical Sciences & Mathematics --- Probabilités --- Statistique mathématique --- EPUB-LIV-FT LIVSTATI SPRINGER-B --- Probability --- Statistical inference --- Mathematics. --- Statistics. --- Applied mathematics. --- Engineering mathematics. --- Probability Theory and Stochastic Processes. --- Statistics for Engineering, Physics, Computer Science, Chemistry and Earth Sciences. --- Appl.Mathematics/Computational Methods of Engineering. --- Combinations --- Chance --- Least squares --- Risk --- Distribution (Probability theory. --- Mathematical and Computational Engineering. --- Engineering --- Engineering analysis --- Mathematical analysis --- Statistical analysis --- Statistical data --- Statistical methods --- Statistical science --- Econometrics --- Distribution functions --- Frequency distribution --- Characteristic functions --- Statistics . --- Probabilités. --- Statistique mathématique.
ISBN: 0387261273 9780387261270 9786610462001 1280462000 0387310754 Year: 2006 Publisher: New York, NY : Springer New York : Imprint: Springer,
Abstract | Keywords | Export | Availability | Bookmark
 Loading...
Choose an application
- Reference Manager
- EndNote
- RefWorks (Direct export to RefWorks)
This book contains 116 exercises of sampling methods solved in detail. The exercises are grouped into chapters and are preceded by a brief theoretical review specifying the notation and the principal results that are useful for understanding the solutions. Some exercises develop the theoretical aspects of surveys, while others deal with more applied problems. Intended for instructors, graduate students and survey practitioners, this book addresses in a lively and progressive way the techniques of sampling, the use of estimators and the methods of appropriate calibration, and the understanding of problems pertaining to non-response. Pascal Ardilly is the Head of the Department of Sampling and Treatment of Statistical Data at the Institut National de la Statistique et des Études Économiques, (INSEE, France). Yves Tillé is a professor at the University of Neuchâtel (Switzerland).
Mathematical statistics --- Sampling (Statistics) --- Social sciences --- Echantillonnage (Statistique) --- Sciences sociales --- Research --- Statistical methods --- Recherche --- Méthodes statistiques --- Sampling (Statistics). --- Statistics - General --- Mathematical Statistics --- Mathematics --- Social Sciences --- Physical Sciences & Mathematics --- -Sampling (Statistics) --- -Social sciences --- -519.52 --- Behavioral sciences --- Human sciences --- Sciences, Social --- Social science --- Social studies --- Civilization --- Random sampling --- Statistics of sampling --- Statistics --- Electronic information resources --- -Statistical methods --- -Electronic information resources --- E-books --- Statistiques Statistiek --- Mathématiques Wiskunde --- Statistical methods. --- Méthodes statistiques --- EPUB-LIV-FT LIVSTATI SPRINGER-B --- Statistics. --- Statistics for Social Science, Behavorial Science, Education, Public Policy, and Law. --- Statistical Theory and Methods. --- Statistics and Computing/Statistics Programs. --- Statistics for Business/Economics/Mathematical Finance/Insurance. --- Statistics for Social Science, Behavioral Science, Education, Public Policy, and Law. --- Statistical analysis --- Statistical data --- Statistical science --- Econometrics --- Research&delete& --- Mathematical statistics. --- Statistics for Social Sciences, Humanities, Law. --- Statistics for Business, Management, Economics, Finance, Insurance. --- Statistical inference --- Statistics, Mathematical --- Probabilities --- Statistics .
ISBN: 0387286594 9780387286594 1441921095 9786610938339 1280938331 0387286780 9781441921093 Year: 2006 Publisher: New York, NY : Springer New York : Imprint: Springer,
Abstract | Keywords | Export | Availability | Bookmark
 Loading...
Choose an application
- Reference Manager
- EndNote
- RefWorks (Direct export to RefWorks)
Copulas are functions that join multivariate distribution functions to their one-dimensional margins. The study of copulas and their role in statistics is a new but vigorously growing field. In this book the student or practitioner of statistics and probability will find discussions of the fundamental properties of copulas and some of their primary applications. The applications include the study of dependence and measures of association, and the construction of families of bivariate distributions. With 116 examples, 54 figures, and 167 exercises, this book is suitable as a text or for self-study. The only prerequisite is an upper level undergraduate course in probability and mathematical statistics, although some familiarity with nonparametric statistics would be useful. Knowledge of measure-theoretic probability is not required. The revised second edition includes new sections on extreme value copulas, tail dependence, and quasi-copulas. Roger B. Nelsen is Professor of Mathematics at Lewis & Clark College in Portland, Oregon. He is also the author of Proofs Without Words: Exercises in Visual Thinking and Proofs Without Words II: More Exercises in Visual Thinking, published by the Mathematical Association of America.
Stochastic processes --- Mathematical statistics --- Copulas (Mathematical statistics) --- Distribution (Probability theory) --- Copules (Statistique mathématique) --- Distribution (Théorie des probabilités) --- Copulas (Mathematical statistics). --- Mathematics --- Physical Sciences & Mathematics --- Mathematical Statistics --- 519.5 --- Copulas (mathematical statistics) --- Copules (Statistique mathématique) --- Distribution (Théorie des probabilités) --- EPUB-LIV-FT LIVSTATI SPRINGER-B --- Mathematics. --- Computer simulation. --- Economics, Mathematical. --- Probabilities. --- Statistics. --- Probability Theory and Stochastic Processes. --- Statistical Theory and Methods. --- Statistics for Business/Economics/Mathematical Finance/Insurance. --- Quantitative Finance. --- Simulation and Modeling. --- Distribution (Probability theory. --- Mathematical statistics. --- Finance. --- Statistics for Business, Management, Economics, Finance, Insurance. --- Distribution functions --- Frequency distribution --- Characteristic functions --- Probabilities --- Computer modeling --- Computer models --- Modeling, Computer --- Models, Computer --- Simulation, Computer --- Electromechanical analogies --- Mathematical models --- Simulation methods --- Model-integrated computing --- Funding --- Funds --- Economics --- Currency question --- Statistical analysis --- Statistical data --- Statistical methods --- Statistical science --- Econometrics --- Statistical inference --- Statistics, Mathematical --- Statistics --- Sampling (Statistics) --- Statistics . --- Economics, Mathematical . --- Mathematical economics --- Probability --- Combinations --- Chance --- Least squares --- Risk --- Methodology
ISBN: 9781852338824 1852338822 1846281245 Year: 2005 Publisher: London, England : Springer,
Abstract | Keywords | Export | Availability | Bookmark
 Loading...
Choose an application
- Reference Manager
- EndNote
- RefWorks (Direct export to RefWorks)
Most data sets collected by researchers are multivariate, and in the majority of cases the variables need to be examined simultaneously to get the most informative results. This requires the use of one or other of the many methods of multivariate analysis, and the use of a suitable software package such as S-PLUS or R. In this book the core multivariate methodology is covered along with some basic theory for each method described. The necessary R and S-PLUS code is given for each analysis in the book, with any differences between the two highlighted. A website with all the datasets and code used in the book can be found at http://biostatistics.iop.kcl.ac.uk/publications/everitt/. Graduate students, and advanced undergraduates on applied statistics courses, especially those in the social sciences, will find this book invaluable in their work, and it will also be useful to researchers outside of statistics who need to deal with the complexities of multivariate data in their work. Brian Everitt is Emeritus Professor of Statistics, King’s College, London.
Methoden en technieken. --- SPlus --- Mathematics. --- Probabilities. --- Statistics. --- Probability Theory and Stochastic Processes. --- Statistics for Social Science, Behavorial Science, Education, Public Policy, and Law. --- Statistical Theory and Methods. --- Statistics and Computing/Statistics Programs. --- S-Plus. --- Statistics for Social Science, Behavioral Science, Education, Public Policy, and Law. --- Statistical analysis --- Statistical data --- Statistical methods --- Statistical science --- Mathematics --- Econometrics --- Probability --- Statistical inference --- Combinations --- Chance --- Least squares --- Mathematical statistics --- Risk --- Math --- Science --- Multivariate analysis --- R (Computer program language) --- #SBIB:303H520 --- 519.2 --- 519.2 Probability. Mathematical statistics --- Probability. Mathematical statistics --- GNU-S (Computer program language) --- Domain-specific programming languages --- Multivariate distributions --- Multivariate statistical analysis --- Statistical analysis, Multivariate --- Analysis of variance --- Matrices --- Methoden sociale wetenschappen: techniek van de analyse, algemeen --- Multivariate analysis. --- R (Computer program language). --- Ruimtelijke planning en ruimtelijk ontwerp --- Analyse multivariée --- R (Langage de programmation) --- EPUB-LIV-FT LIVSTATI SPRINGER-B
ISBN: 0817643869 081764444X 9780817643867 Year: 2006 Publisher: Boston, MA : Birkhäuser Boston : Imprint: Birkhäuser,
Abstract | Keywords | Export | Availability | Bookmark
 Loading...
Choose an application
- Reference Manager
- EndNote
- RefWorks (Direct export to RefWorks)
"…the author has packaged an excellent and modern set of topics around the development and use of quantitative models.... If you need to learn about resampling, this book would be a good place to start." —Technometrics (Review of the Second Edition) This thoroughly revised and expanded third edition is a practical guide to data analysis using the bootstrap, cross-validation, and permutation tests. Only requiring minimal mathematics beyond algebra, the book provides a table-free introduction to data analysis utilizing numerous exercises, practical data sets, and freely available statistical shareware. Topics and Features * Practical presentation covers both the bootstrap and permutations along with the program code necessary to put them to work. * Includes a systematic guide to selecting the correct procedure for a particular application. * Detailed coverage of classification, estimation, experimental design, hypothesis testing, and modeling. * Suitable for both classroom use and individual self-study. New to the Third Edition * Procedures are grouped by application; a prefatory chapter guides readers to the appropriate reading matter. * Program listings and screen shots now accompany each resampling procedure: Whether one programs in C++, CART, Blossom, Box Sampler (an Excel add-in), EViews, MATLAB, R, Resampling Stats, SAS macros, S-PLUS, Stata, or StatXact, readers will find the program listings and screen shots needed to put each resampling procedure into practice. * To simplify programming, code for readers to download and apply is posted at http://www.springeronline.com/0-8176-4386-9. * Notation has been simplified and, where possible, eliminated. * A glossary and answers to selected exercises are included. With its accessible style and intuitive topic development, the book is an excellent basic resource for the power, simplicity, and versatility of resampling methods. It is an essential resource for statisticians, biostatisticians, statistical consultants, students, and research professionals in the biological, physical, and social sciences, engineering, and technology.
Statistical science --- Mathematical statistics --- Resampling (Statistics). --- Basic Sciences. Statistics --- Probability Theory, Sampling Theory. --- Mathematics. --- Mathematical analysis. --- Analysis (Mathematics). --- Probabilities. --- Statistics. --- Probability Theory and Stochastic Processes. --- Analysis. --- Statistical Theory and Methods. --- Statistics, general. --- Statistics for Engineering, Physics, Computer Science, Chemistry and Earth Sciences. --- Statistics for Life Sciences, Medicine, Health Sciences. --- Statistical analysis --- Statistical data --- Statistical methods --- Mathematics --- Econometrics --- Probability --- Statistical inference --- Combinations --- Chance --- Least squares --- Risk --- 517.1 Mathematical analysis --- Mathematical analysis --- Math --- Science --- Resampling (Statistics) --- Resampling methods (Statistics) --- Nonparametric statistics --- Statistics --- Rééchantillonnage (Statistique) --- EPUB-LIV-FT LIVSTATI SPRINGER-B --- Distribution (Probability theory. --- Global analysis (Mathematics). --- Mathematical statistics. --- Statistics, Mathematical --- Probabilities --- Sampling (Statistics) --- Analysis, Global (Mathematics) --- Differential topology --- Functions of complex variables --- Geometry, Algebraic --- Distribution functions --- Frequency distribution --- Characteristic functions --- Statistics .
ISBN: 0387293175 9780387293172 0387362762 Year: 2006 Publisher: New York, NY : Springer New York : Imprint: Springer,
Abstract | Keywords | Export | Availability | Bookmark
 Loading...
Choose an application
- Reference Manager
- EndNote
- RefWorks (Direct export to RefWorks)
Time Series Analysis and Its Applications, Second Edition, presents a balanced and comprehensive treatment of both time and frequency domain methods with accompanying theory. Numerous examples using non-trivial data illustrate solutions to problems such as evaluating pain perception experiments using magnetic resonance imaging, monitoring a nuclear test ban treaty, evaluating the volatility of an asset, or finding a gene in a DNA sequence. The book is designed to be useful as a text for graduate level students in the physical, biological and social sciences and as a graduate level text in statistics. Some parts may also serve as an undergraduate introductory course. Material from the first edition of the text has been updated by adding examples and associated code based on the freeware R statistical package. As in the first edition, modern developments involving categorical time series analysis and the spectral envelope, multivariate spectral methods, long memory series, nonlinear models, longitudinal data analysis, resampling techniques, GARCH models, stochastic volatility models, wavelets, and Monte Carlo Markov chain integration methods are incorporated in the text. In this edition, the material has been divided into smaller chapters, and the coverage of financial time series, including GARCH and stochastic volatility models, has been expanded. These topics add to a classical coverage of time series regression, univariate and multivariate ARIMA models, spectral analysis and state-space models. R.H. Shumway is Professor of Statistics at the University of California, Davis. He is a Fellow of the American Statistical Association and a member of the International Statistical Institute. He won the 1986 American Statistical Association Award for Outstanding Statistical Application and the 1992 Communicable Diseases Center Statistics Award; both awards were for joint papers on time series applications. He is the author of a previous 1988 Prentice-Hall text on applied time series analysis. D.S. Stoffer is Professor of Statistics at the University of Pittsburgh. He has made seminal contributions to the analysis of categorical time series and won the 1989 American Statistical Association Award for Outstanding Statistical Application in a joint paper analyzing categorical time series arising in infant sleep-state cycling. He is currently a Departmental Editor for the Journal of Forecasting and Associate Editor of the Annals of the Institute of Statistical Mathematics. .
Mathematical statistics --- Time-series analysis --- Série chronologique --- Série chronologique. --- Tijdreeksen. -- gtt. --- Time-series analysis. --- Toepassingen. -- gtt. --- Mathematical Statistics --- Mathematics --- Physical Sciences & Mathematics --- AA / International- internationaal --- 303.0 --- 304.0 --- 519.2 --- 304.5 --- 305.96 --- tijdreeksanalyse --- 519.246 --- Analysis of time series --- Autocorrelation (Statistics) --- Harmonic analysis --- Probabilities --- Statistische technieken in econometrie. Wiskundige statistiek (algemene werken en handboeken). --- Zuivere statistische analyse (algemene naslagwerken). Tijdreeksen. --- Wiskundige statistiek --- Techniek van de statistische-econometrische voorspellingen. Prognose in de econometrie. --- Macro-economisch model van een of verschillende landen. --- Statistics of stochastic processes. Estimation of stochastic processes. Hypothesis testing. Statistics of point processes. Time series analysis. Auto-correlation. Regression --- Série chronologique. --- Tijdreeksen. --- Toepassingen. --- 519.246 Statistics of stochastic processes. Estimation of stochastic processes. Hypothesis testing. Statistics of point processes. Time series analysis. Auto-correlation. Regression --- Série chronologique --- EPUB-LIV-FT LIVSTATI SPRINGER-B --- Statistics. --- Statistical Theory and Methods. --- Statistics for Life Sciences, Medicine, Health Sciences. --- Statistische technieken in econometrie. Wiskundige statistiek (algemene werken en handboeken) --- Zuivere statistische analyse (algemene naslagwerken). Tijdreeksen --- Techniek van de statistische-econometrische voorspellingen. Prognose in de econometrie --- Macro-economisch model van een of verschillende landen --- Mathematical statistics. --- Statistical analysis --- Statistical data --- Statistical methods --- Statistical science --- Econometrics --- Statistical inference --- Statistics, Mathematical --- Statistics --- Sampling (Statistics) --- Statistics . --- R (Computer program language). --- GNU-S (Computer program language) --- Domain-specific programming languages
ISBN: 0387329064 9780387329062 9786610938421 1280938420 0387379770 Year: 2006 Publisher: New York, NY : Springer New York : Imprint: Springer,
Abstract | Keywords | Export | Availability | Bookmark
 Loading...
Choose an application
- Reference Manager
- EndNote
- RefWorks (Direct export to RefWorks)
Graphics are great for exploring data, but how can they be used for looking at the large datasets that are commonplace to-day? This book shows how to look at ways of visualizing large datasets, whether large in numbers of cases or large in numbers of variables or large in both. Data visualization is useful for data cleaning, exploring data, identifying trends and clusters, spotting local patterns, evaluating modeling output, and presenting results. It is essential for exploratory data analysis and data mining. Data analysts, statisticians, computer scientists-indeed anyone who has to explore a large dataset of their own-should benefit from reading this book. New approaches to graphics are needed to visualize the information in large datasets and most of the innovations described in this book are developments of standard graphics. There are considerable advantages in extending displays which are well-known and well-tried, both in understanding how best to make use of them in your work and in presenting results to others. It should also make the book readily accessible for readers who already have a little experience of drawing statistical graphics. All ideas are illustrated with displays from analyses of real datasets and the authors emphasize the importance of interpreting displays effectively. Graphics should be drawn to convey information and the book includes many insightful examples. Antony Unwin holds the Chair of Computer Oriented Statistics and Data Analysis at the University of Augsburg. He has been involved in developing visualization software for twenty years. Martin Theus is a Senior Researcher at the University of Augsburg, has worked in industry and research in both Germany and the USA, and is the author of the visualization software Mondrian. Heike Hofmann is Assistant Professor of Statistics at Iowa State University. She wrote the software MANET and has also cooperated in the development of the GGobi software.
Artificial intelligence. Robotics. Simulation. Graphics --- Information systems --- QA 276.3 Graphic methods --- Computational Science & Engineering --- Computational Statistics --- Computer Imaging, Graphics & Vision --- Computer Science --- Statistics --- Computer graphics. --- Statistique --- Infographie --- Graphic methods. --- Méthodes graphiques --- Computer graphics --- Graphic methods --- Statistics -- Graphic methods. --- Mathematics --- Physical Sciences & Mathematics --- Mathematical Statistics --- Méthodes graphiques --- EPUB-LIV-FT LIVSTATI SPRINGER-B --- Automatic drafting --- Graphic data processing --- Graphics, Computer --- Diagrams, Statistical --- Statistical diagrams --- Mathematics. --- Operations research. --- Decision making. --- Data mining. --- Visualization. --- Computer software. --- Statistics. --- Mathematical Software. --- Statistical Theory and Methods. --- Data Mining and Knowledge Discovery. --- Operation Research/Decision Theory. --- Computer Graphics. --- Computer art --- Graphic arts --- Electronic data processing --- Engineering graphics --- Image processing --- Statistical analysis --- Statistical data --- Statistical methods --- Statistical science --- Econometrics --- Software, Computer --- Computer systems --- Visualisation --- Imagery (Psychology) --- Imagination --- Visual perception --- Algorithmic knowledge discovery --- Factual data analysis --- KDD (Information retrieval) --- Knowledge discovery in data --- Knowledge discovery in databases --- Mining, Data --- Database searching --- Deciding --- Decision (Psychology) --- Decision analysis --- Decision processes --- Making decisions --- Management --- Management decisions --- Choice (Psychology) --- Problem solving --- Operational analysis --- Operational research --- Industrial engineering --- Management science --- Research --- System theory --- Math --- Science --- Digital techniques --- Decision making --- Curve fitting --- Mathematical statistics. --- Operations Research/Decision Theory. --- Statistical inference --- Statistics, Mathematical --- Probabilities --- Sampling (Statistics) --- Statistics . --- Statistics - Graphic methods
| Listing 1 - 10 of 10 |
Sort by
|

 Search
 Feedback
 About
About Help
Help News
News